

この記事は GRIPHONE Advent Calendar 2019 4日目の記事です。
こんにちは。SREの川野です。
今回は、Prometheusについてご紹介します!
CloudNativeなアーキテクチャにしていく上で重要な可観測性を実現するためのツールの1つなので、今回は入門としてGetting startedをやっていきたいと思います。
Prometheusとは
OSSのシステム監視およびアラートツールです。
2016年にKubernetesに続く2番目のホストプロジェクトとしてCloud Native Computing Foundationに参加しています。
Prometheusは、以下のような機能を持っています。
- メトリック名とキー/バリューのペアで識別される時系列データを持つ多次元データモデル
- PromQL(Prometheus Query Language)と呼ばれる時系列データを活用するための柔軟なクエリ言語
- 分散ストレージに依存せず、単一サーバーノードは自律的
- 時系列の収集は、HTTP経由のpull modelを介して行う
- ターゲットは、サービス検出または静的構成を介して検出
- グラフ作成やダッシュボードなどのサポート
実際に使ってみる
公式ドキュメントのGetting startedにしたがって進めていきます。
最新の2.14.0をローカル(MacOSX)にダウンロードして展開します。
$ wget https://github.com/prometheus/prometheus/releases/download/v2.14.0/prometheus-2.14.0.darwin-amd64.tar.gz
$ tar xvfz prometheus-2.14.0.darwin-amd64.tar.gz
$ cd prometheus-2.14.0.darwin-amd64
Prometheusの設定ファイル(prometheus.yml)を以下のように書き換えます。
$ vim prometheus.ymlglobal:
scrape_interval: 15s # By default, scrape targets every 15 seconds.
# Attach these labels to any time series or alerts when communicating with
# external systems (federation, remote storage, Alertmanager).
external_labels:
monitor: 'codelab-monitor'
# A scrape configuration containing exactly one endpoint to scrape:
# Here it's Prometheus itself.
scrape_configs:
# The job name is added as a label `job=<job_name>` to any timeseries scraped from this config.
- job_name: 'prometheus'
# Override the global default and scrape targets from this job every 5 seconds.
scrape_interval: 5s
static_configs:
- targets: ['localhost:9090']設定が終わったらPrometheusを起動してみます。
$ ./prometheus --config.file=prometheus.yml
level=info ts=2019-12-02T06:00:27.070Z caller=main.go:296 msg="no time or size retention was set so using the default time retention" duration=15d
level=info ts=2019-12-02T06:00:27.076Z caller=main.go:332 msg="Starting Prometheus" version="(version=2.14.0, branch=HEAD, revision=edeb7a44cbf745f1d8be4ea6f215e79e651bfe19)"
level=info ts=2019-12-02T06:00:27.076Z caller=main.go:333 build_context="(go=go1.13.4, user=root@df2327081015, date=20191111-14:34:50)"
level=info ts=2019-12-02T06:00:27.076Z caller=main.go:334 host_details=(darwin)
level=info ts=2019-12-02T06:00:27.076Z caller=main.go:335 fd_limits="(soft=256, hard=unlimited)"
level=info ts=2019-12-02T06:00:27.076Z caller=main.go:336 vm_limits="(soft=unlimited, hard=unlimited)"
level=info ts=2019-12-02T06:00:27.092Z caller=web.go:496 component=web msg="Start listening for connections" address=0.0.0.0:9090
level=info ts=2019-12-02T06:00:27.098Z caller=main.go:657 msg="Starting TSDB ..."
level=info ts=2019-12-02T06:00:27.159Z caller=head.go:535 component=tsdb msg="replaying WAL, this may take awhile"
level=info ts=2019-12-02T06:00:27.160Z caller=head.go:583 component=tsdb msg="WAL segment loaded" segment=0 maxSegment=1
level=info ts=2019-12-02T06:00:27.160Z caller=head.go:583 component=tsdb msg="WAL segment loaded" segment=1 maxSegment=1
level=info ts=2019-12-02T06:00:27.162Z caller=main.go:672 fs_type=18
level=info ts=2019-12-02T06:00:27.162Z caller=main.go:673 msg="TSDB started"
level=info ts=2019-12-02T06:00:27.162Z caller=main.go:743 msg="Loading configuration file" filename=prometheus.yml
level=info ts=2019-12-02T06:00:27.224Z caller=main.go:771 msg="Completed loading of configuration file" filename=prometheus.yml
level=info ts=2019-12-02T06:00:27.224Z caller=main.go:626 msg="Server is ready to receive web requests."
ブラウザで、http://localhost:9090にアクセスすると、Prometheusの画面を確認することができます。
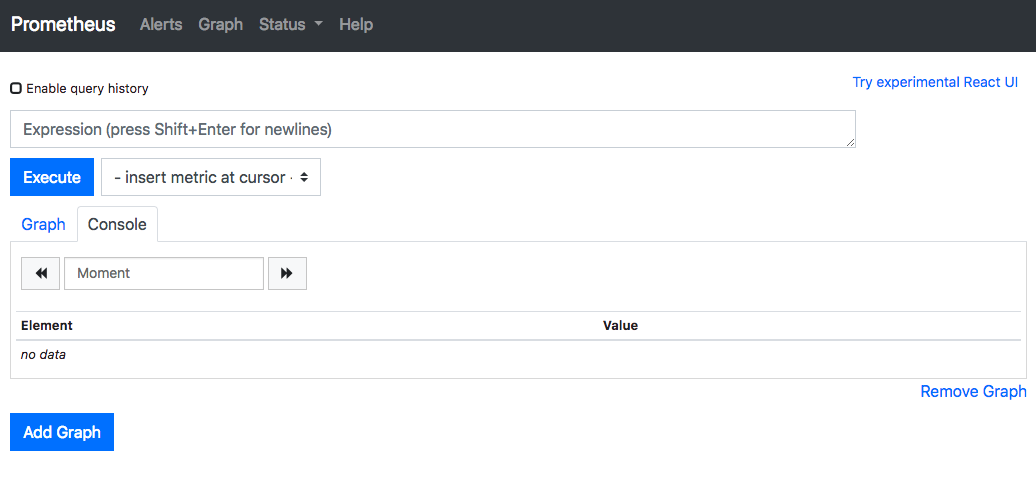
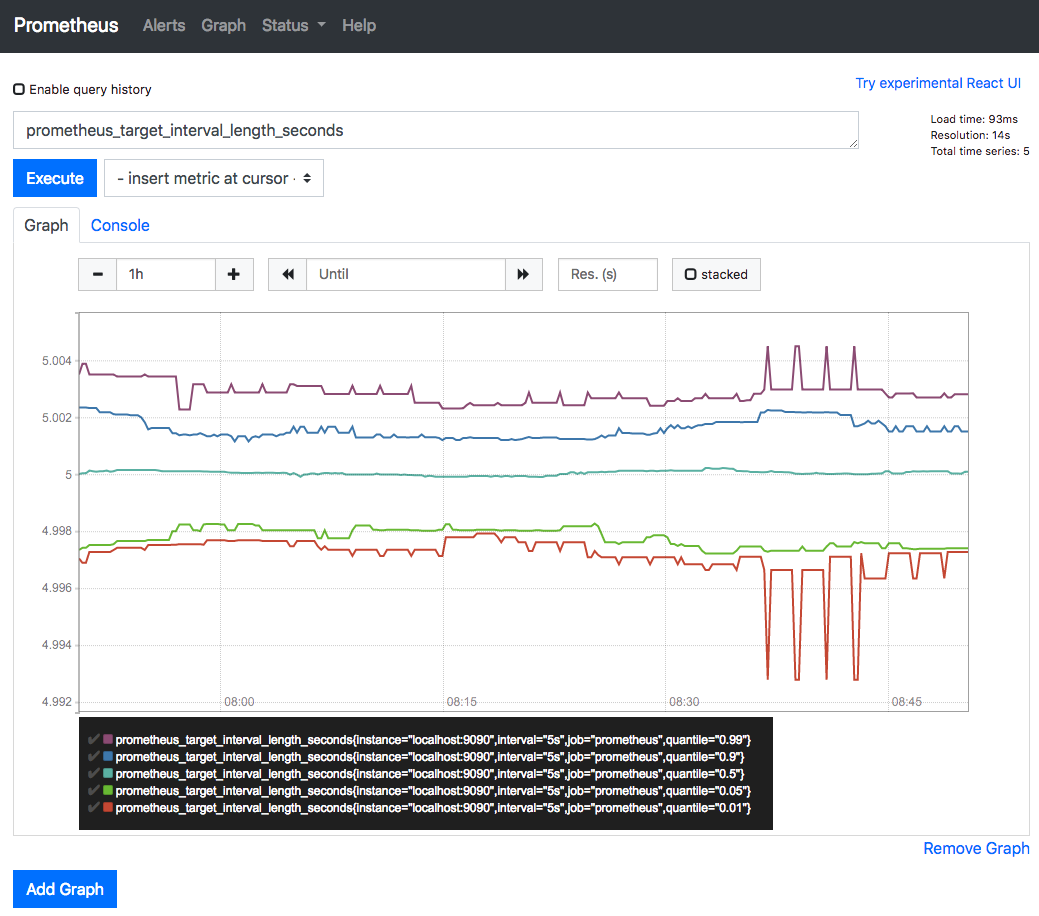
http://localhost:9090/graph にアクセスするとクエリを入力できるフォームがあるので、prometheus_target_interval_length_secondsと入力し、Executeを押してGraphタブを押すと取得できたメトリクスがグラフに描画されていることがわかります。これは先ほど prometheus.yml で設定した scrape_interval の実際の動作を監視しています。監視対象(ターゲット)の各メトリクスを5秒おきに収集するという設定をしたので、大体5秒くらいになっていることがわかります。また、Prometheusではメトリクスを収集することをスクレイプと呼びます。
現状、他にも監視できているメトリクスは、http://localhost:9090/metrics で確認することができます。
続いてサンプルとなる監視対象(ターゲット)を追加して、スクレイプするための設定をしていきます。サンプルターゲットは、OSSのGoのクライアントライブラリを使って起動・作成していきます。
$ git clone https://github.com/prometheus/client_golang.git
$ cd client_golang/examples/random
$ go get -d (※タイムアウトすることがあるようですが、何度かやってるとできるようになります)
$ go build
別のターミナルを3つ開いてそれぞれ以下を実行します。
$ ./random -listen-address=:8080
$ ./random -listen-address=:8081
$ ./random -listen-address=:8082
また、以下エンドポイントでそれぞれで監視できているメトリクスを確認できます。
http://localhost:8080/metrics
http://localhost:8081/metrics
http://localhost:8082/metrics
続いてサンプルターゲットをスクレイプするためにPrometheusの設定を変更していきます。
3つのエンドポイントをexample-randomという1つのジョブにグループ化します。ただし、最初の2つのエンドポイントをプロダクション、3つ目がカナリアインスタンスを表すことを想定してやっていきます。各ターゲットのグループにラベルを追加することができるので、group=”production”, group=”canary”といったラベルを追加します。
prometheus.ymlのスクレイプ設定を以下のように変更して再起動します。
scrape_configs:
  # The job name is added as a label `job=<job_name>` to any timeseries scraped from this config.
  - job_name: 'example-random'

    # metrics_path defaults to '/metrics'
    # scheme defaults to 'http'.

    scrape_interval: 5s

    static_configs:
        - targets: ['localhost:8080', 'localhost:8081']
          labels:
              group: 'production'

        - targets: ['localhost:8082']
          labels:
              group: 'canary'
ブラウザで http://localhost:9090/graph に再度アクセスし、以下のようなクエリを入力すれば対象となるメトリクスを絞ることができます。
rpc_durations_seconds{group=”production”}
この例では問題はないのですが、アドホックに計算すると数千のメトリクスを集計するクエリが遅くなる場合があります。スクレイプを効率化するために、例えば全てのインスタンスで5分間で測定された平均のRPC1秒あたりのレートを記録するには以下のようにかきます。
avg(rate(rpc_durations_seconds_count[5m])) by (job, service)
この式をあらかじめカスタムメトリクスのような形でprometheus.ymlに設定し、使うこともできます。
$ vim prometheus.rules.ymlgroups:
- name: example
rules:
- record: job_service:rpc_durations_seconds_count:avg_rate5m
expr: avg(rate(rpc_durations_seconds_count[5m])) by (job, service)prometheus.yml でこの作成した prometheus.rules.yml を読み込む設定を rule_files に追加します。
global:
  scrape_interval:     15s # By default, scrape targets every 15 seconds.
  evaluation_interval: 15s # Evaluate rules every 15 seconds.

  # Attach these extra labels to all timeseries collected by this Prometheus instance.
  external_labels:
    monitor: 'codelab-monitor'

rule_files:
  - 'prometheus.rules.yml'

scrape_configs:
  - job_name: 'prometheus'

    # Override the global default and scrape targets from this job every 5 seconds.
    scrape_interval: 5s

    static_configs:
      - targets: ['localhost:9090']

  - job_name:       'example-random'

    # Override the global default and scrape targets from this job every 5 seconds.
    scrape_interval: 5s

    static_configs:
      - targets: ['localhost:8080', 'localhost:8081']
        labels:
          group: 'production'

      - targets: ['localhost:8082']
        labels:
          group: 'canary'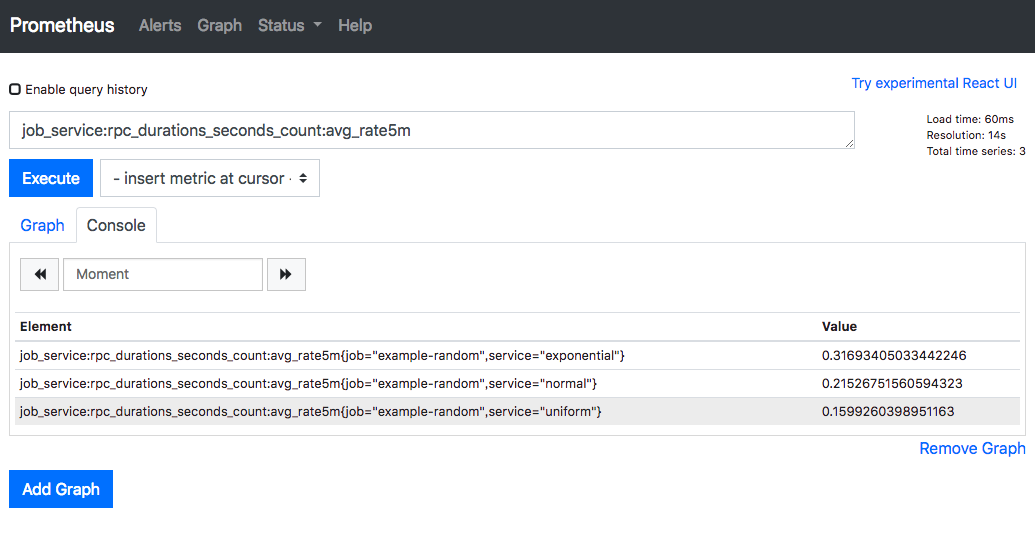
終わりに
今回Prometheusを初めて触ってみましたが、公式ドキュメント通りにGetting startedを進めることができました。欲しいメトリクスを収集するためにPromQLをどうやって書くか、というのが難しそうだなと思いました。また、運用で使っていくとグラフをチームの人が追加や変更をしていくと思うのですが、その差分をどうやって管理していくのかがわからなかったりしたので引き続き調査していこうと思います!
次回は、Grafanaという可視化ツールと今回のPrometheusを連携して、収集したメトリクスをより見やすくしたダッシュボードを作成してみようと思います!